Chapter 4: Graphics
The key elements to any infographic are, of course, the graphics. If a picture is worth a thousand words, then an infographic is worth an entire book – all spread out and placed on a single background to be skimmed quickly for gathering information. Graphics help to grab a viewer’s attention, make it quicker to understand information, put things in context using comparative images, help foreign language speakers and illiterates understand information, and use the “Picture Superiority Effect” to make messages more memorable (Krum, 2014, p. 287).
The choices a designer has to make for graphics are to use original sketches, original bitmap photographs (also known as raster images), or to create their own vector images. Another option is to use existing images from the Internet, which brings us to copyright issues.
Copyrights
The problem with using images that exist on the Internet is getting the permission to use the images from their creators so that no copyrights are infringed upon (nobody likes a thief). It’s one thing to use so called “borrowed” images from the Internet when putting together a project for school (as long as the original owners of the images are properly cited), but if the finished product is published for the world to see, and permission has not been granted for reproduction, then the ramifications could be disastrous for not only the designer, but also for the designer’s client if the original owners of the images decide to file a law suit. By developing photography and illustration skills, a designer is able to use existing graphics only as inspirations for original work instead of “borrowing” work from others.
Here are examples of different types of usage rights and their corresponding symbols:
Copyright

- The work cannot be copied without the owner’s permission.
- Original works are automatically copyrighted when they are created.
- To file a claim of infringement in the United States, a work must be registered with the U.S. Copyright Office.
Creative Commons

- Creators of the work set the usage rights (see next page for 6 options).
- Gives others the right to use, share, and modify the work.
- Creative Commons licenses work along with copyrights, allowing a creator to change the terms to fit their needs.
Public Domain

- Work in the public domain can be used and modified freely.
- Includes: non-copyrightable material (titles, ideas, facts, names, etc.); work that has been created specifically for the public domain; work that was created before 1923; and expired copyrights of work from 1923-1977.
Creative Commons License Options:
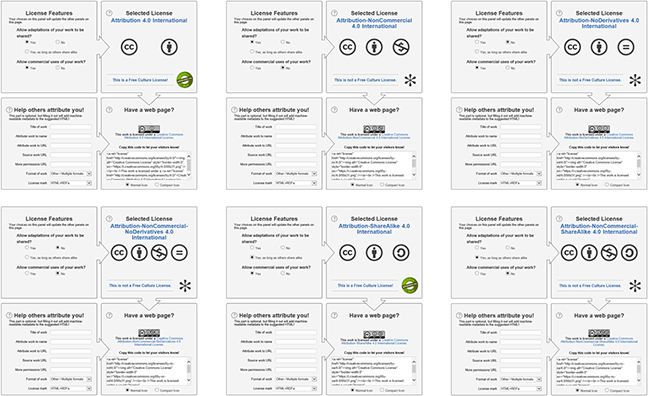
For a clearer understanding (and clearer images) of the above options, go to creativecommons.org/choose/
Raster Graphics vs. Vector Graphics
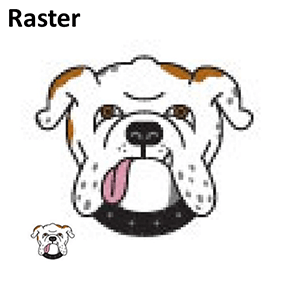
Raster graphics work with pixels. When pixels are enlarged, they become blurry looking and have jagged edges. They are best used for web graphics, photographs, painted artwork with blended colors, and for working with tonal and color effects.
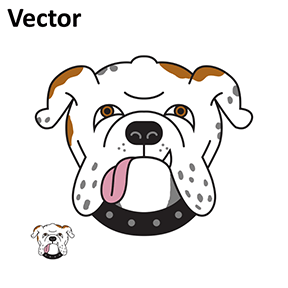
Vector graphics are made up of geometric shapes and mathematic equations. They can easily be resized without losing any clarity. They are best used for signs, logos, and anything that needs to work in a mix of very large to very small formats.
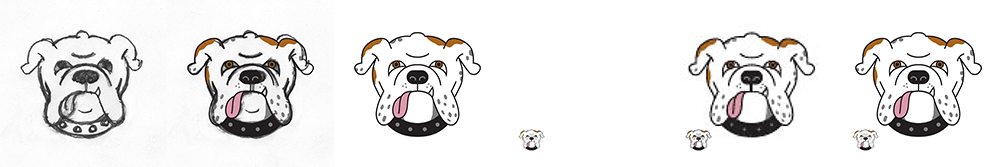
Reflections on Creating Graphics
I started the graphic of the Bulldog with a pencil sketch. I then placed the sketch into Adobe Illustrator™ and traced half of it with the Pen Tool (adjusting the lines using their anchors and Bezier handles), and then copied and pasted a reflection and joined the two halves, and then drew the tongue and tooth. I painted some accent colors with the Brush Tool (freehand). Once the vector was complete, I converted all of the lines to shapes and then I shrunk it down and exported it as a small raster (JPEG) image in the bottom left corner of the Artboard. To create an example of a resized raster image, showing the blurry looking, jagged pixelated effect, I opened the JPEG in Microsoft Paint™, and then copied and pasted and enlarged the image to match the size of the original vector graphic. I then combined the small vector and the large vector to make the example on the far right, which shows no degradation of the image at either size.
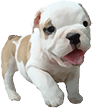
The graphic of the Bulldog puppy seen at left was done by opening a JPEG raster image (personal photo) in Adobe Photoshop™, then removing the background, then saving the image as a PNG file. I then pasted it into PowerPoint™ and changed it with the built-in “Artistic Effects,” using the “Paint Brush” effect to make the photo look more like artwork.