Chapter 5: Information Structure
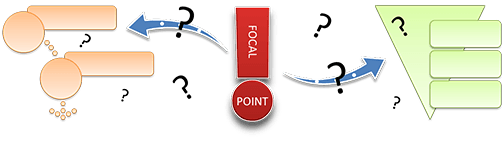
An infographic’s information structure is what gives your audience a direction to follow. The main focal point of an infographic is what draws the readers in, but how you set up the rest of the infographic determines how the readers will navigate through the information laid out before them. You want to find the best solution to communicate your message as quickly and as logically as you can.
The three main types of information structures for infographics are the hierarchy structure, the sequence structure, and the interactive structure. All three structures work well online, but only the hierarchy and sequence structures will work as printed material for all of the functions that infographics serve (education, advertising, marketing, and public relations).
Examples
Hierarchy Structure
The hierarchy structure puts the most important topic as the main focal point – usually a title, or name, or theme – and information is structured from the most important to the least important, from the main topic to sub-topics and then details of each of the sub-topics. However, there are times when certain sub-topics or their details need to stand out, thus giving that information its own visually hierarchal role.
Although a hierarchy structure is typically built from top to bottom (as seen in the example shown below), it can also go from left to right, bottom to top, or it can radiate from the center of the design with all of the sub-topics and their details branching out in every direction.
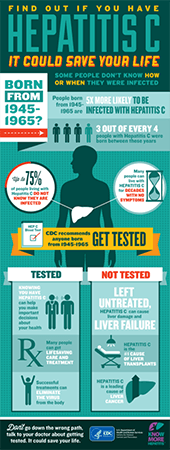
The hierarchy structure of the infographic seen above draws the eye to the main topic at the top and aims at a target audience of people born between 1945 and 1965. The use of the large text at the center (“GET TESTED”) puts the call-to-action in plain sight, so if someone only skims the infographic, and does not stop to read all of the other information, the message still gets across to the reader.
Sequence Structure
The sequence structure is best used for timelines, instructions, and anything that needs to follow a certain order. The sequence structure usually has the information following a path or line, or it is put in a numbered or lettered order, making all of the information placed in the design dependent upon the information before it.
The most common layouts of sequence structures are left to right or top down (as seen in the example shown below). However, the main topic can be placed in the center, as long as the surrounding information is labeled so readers to know where to start.
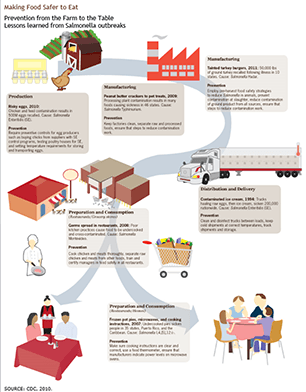
The infographic seen above uses a path for the reader to follow a sequence of events. Within 5 seconds, just by looking at the graphics, the reader can tell the infographic involves the journey of a chicken from its source to the dinner table. The target audience for this is any health-conscious meat eater.
Interactive Structure
The interactive structure is only used online. Each section or graphic within the design is either clicked on or hovered over with a cursor to open another web page or a pop-up box to reveal more information.
The layout styles of interactive structures found online vary drastically, using both hierarchy and sequence structures, as well as maps, trees, body parts, cycles, grids, data visualizations, and matrixes. In fact, the design possibilities are endless for interactive infographics.
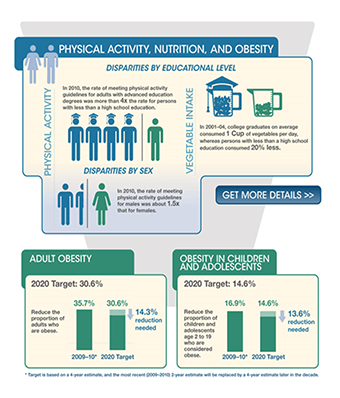
The infographic seen above can be found on the Centers for Disease Control (CDC) website; its target audience is anyone concerned with obesity. When different parts of the design are clicked, new web pages open (within the CDC site) that contain in-depth detailed information on each subject.
Outline for my Bulldog Infographic
Before adopting an ENGLISH BULLDOG – know these facts:
I. Birth
A. Breeders: Make sure the breeder you deal with is reputable. Get papers for your puppy.
B. Birthing: All English Bulldogs must be birthed via C-section because of their large heads.
II. Puppy Stage
A. Housebreaking: Housebreaking takes several months. Invest in good quality cloth wee-wee pads.
B. Chewing: Get lots of strong toys so your puppy is less likely to chew on your wood furniture.
III. Adolescence
A. Teaching & Obedience: They are easily trained, and are fairly smart, but they can be very stubborn and defiant.
B. Temperature control: Seizures can occur if they get too hot, and they need to wear coats in the cold weather.
IV. Adulthood
A. Cleanliness: Their eyes, ears, tails, and facial folds need to be constantly cleaned. They like to get dirty.
B. Weight: They are extremely strong, but they are lazy; avoid obesity with good diet and exercise.
V. Old Age
A. Health: Health issues include problems with the skin, heart, brain, eyes, and respiratory system.
B. Life expectancy: Their average lifespan is only 8-12 of our years. A 10-year-old Bulldog is 65 in dog years.
Sources: Association for Pet Obesity Prevention (2014); The Bulldog Information Library (2012); Pedigree (2015) All things dog: Dog age calculator.
Wireframe
Wireframes are an important step to take before building an infographic; they help a designer lay out a basic plan for their design and are where most of the changes are made before committing to a final piece.
Below, you will find the wireframe for the infographic that will be created for a fictitious client. The structure used in this infographic is a combination of the hierarchy structure and the sequence structure, but it could also be used for an interactive structure if needed. The 17”x11” layout will fit a landscape oriented poster and most modern computer screens.
In accordance with the hierarchy structure, the 36 point headline will be at the top with the 24 point sub-headlines below that, and the 16 point body copy below each subhead. However, in accordance with the sequence structure, the information contained within the design pertains to the different stages within the lifespan of a Bulldog and reads top-to-bottom and left-to-right. A hierarchy structure is also present in the graphics with the use of the Picture Superiority Effect (explained in Chapter 1), wherein the body copy is sandwiched between the images that catch a viewer’s eye.
The images that will be used across the bottom of the infographic will be a combination of vector graphics (created using shapes, lines, and text in Adobe Illustrator™) and personal photographs of Bulldogs – altered using Adobe Photoshop™ and the “Image Trace” tool in Adobe Illustrator™ which converts raster images into vector graphics. The converted photos will then be recolored using the colors from my Style Guide (seen in Chapter 3).
Wireframe:
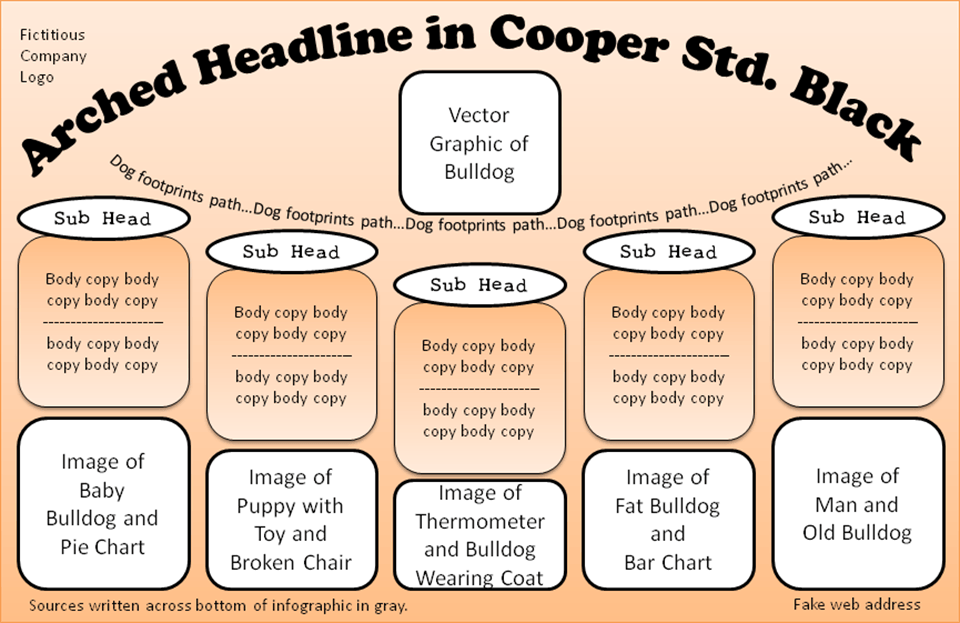
Wireframe created using PowerPoint shapes and text.
Infographic for Fictitious Client
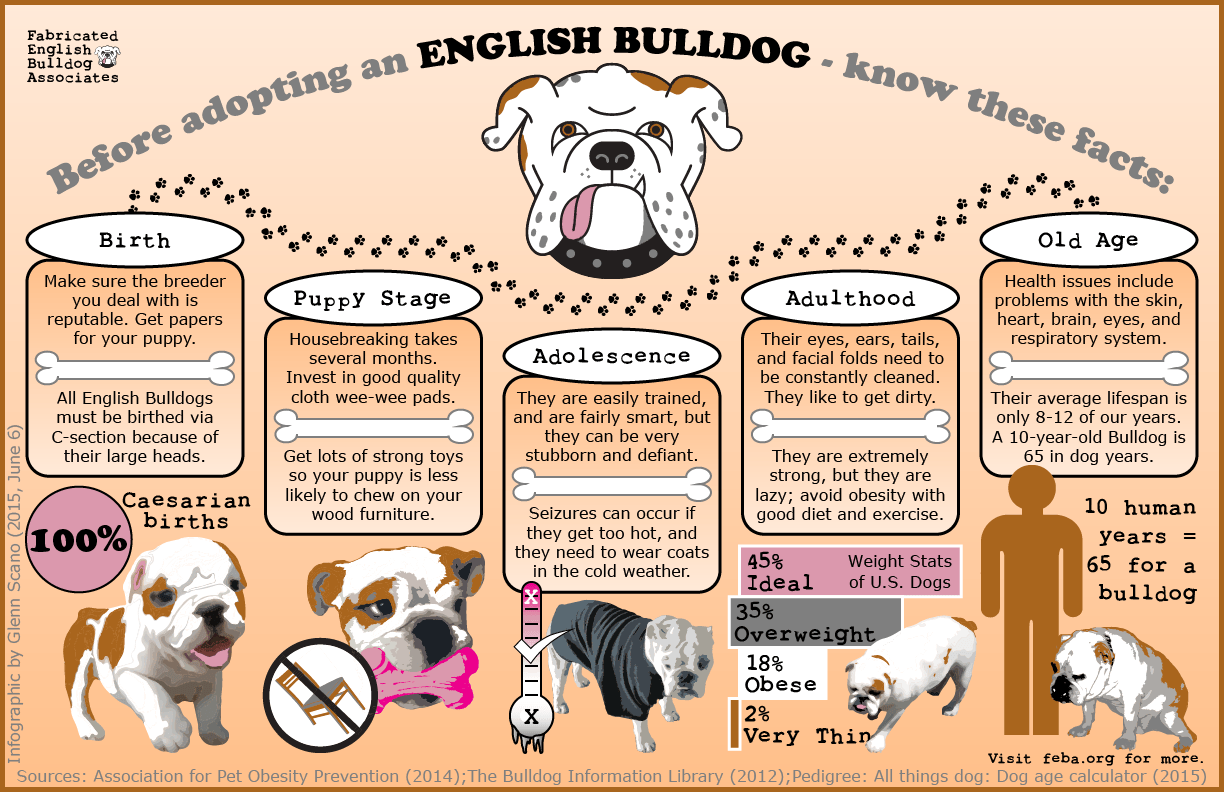
17”x11” poster-size infographic created using Adobe Illustrator™ resized to fit this page.