Chapter 2: Visual Design Principles
Gestalt Principles
To fully explain the elements of gestalt principles would take pages of writing, but I will put it in a nutshell; humans like to put things in order, and we like simplicity. We are able to take large groups of smaller images and organize them into a single image. How many times have you looked at a group of random lines on a page (or in the case of the image above, dots) only to realize that there was a face or figure in the randomness? With the use of unity (harmony) – using lines, shapes, value, contrast, and continuity – designers can control not only what is seen, but how it is seen and made to be understood.
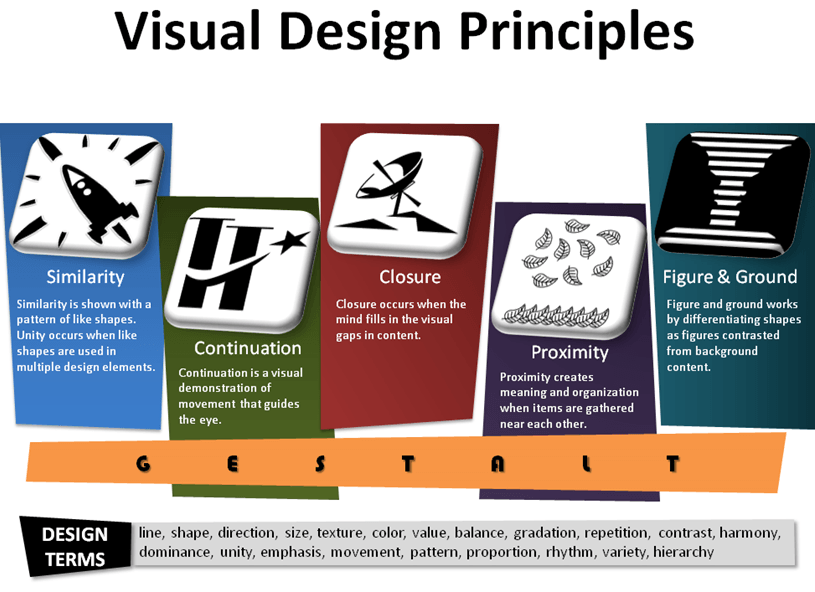
Replicated Visual Design Principles Infographic:
An Original Example of Closure:
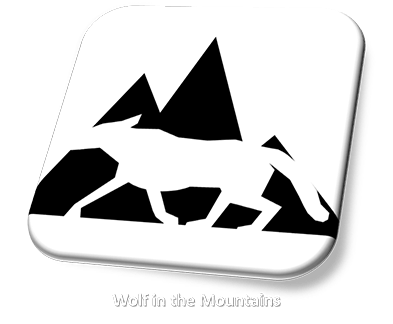
In my example of closure, I have drawn the shape of a wolf against a mountain range. Closure is the visual ability that we possess which automatically connects the missing links within a design and creates lines where lines do not exist.
Reflections on Creating Gestalt Principles
In the process of recreating the infographic of visual design principles, I found two of the images (the satellite dish and the figure and ground image) were too difficult for me to replicate using the tools available in PowerPoint, so I ended up using the tools available in Adobe Illustrator in order to get the results I was looking to achieve.
There are many digital tools available to help create vector (and raster) images for infographics; the trick is to know which digital tool will serve you best as a designer to achieve the results that you want. The fact that most of the digital tools are compatible with each other, and allow you to work between them no matter which company makes them, is the biggest advantage for designing infographics.
The use of gestalt principles in infographics is important because you do not want to overwhelm your audience with too much detail; you want them to glean the information quickly.

Types of Online Infographics
- Informative: The most common type of online infographic. According to Krum (2014), people are more apt to “read and share valuable information instead of advertisements” (p. 69). Businesses that use these types of infographics are more likely to build a following than if they used advertising alone.
- Persuasive: This type of infographic is used when there is a call to action and the goal is to make the audience do something after reading the message. However, readers should be skeptical of the bias contained in these types of infographics.
- Visual Explanations: This type of infographic is less likely to use data visualizations (charts and graphs) and is used mainly for conveying ideas, instructions, processes, and relationships with the use of icons, pictures, and diagrams.
- Advertisements: This type of infographic is also a persuasive infographic, but the call to action is for the reader to buy something. This type of infographic is less likely to be shared, but is often used to educate consumers.
- Public Relations: PR infographics often go hand-in-hand with press releases. This type of infographic is used to help build awareness, inform shareholders, and attempt to build value of the product or brand (Krum, p. 88).
- Posters: Although they are not online, printed versions of infographics are becoming a growing trend, and can be purchased online or in stores.
Online Infographic Formats
Vertical Layout
There are three formats for online infographics: vertical, horizontal, and full-screen. The vertical format, which is also known as “tall, long, or tower” (Krum, 2014, p. 58), is the most common type of infographic found online. This type of infographic can contain a large amount of information due to the ability of scrolling up and down with a computer mouse.
The vertical infographic seen here, created by Daniel Dannenberg (2011), is actually 670 pixels (7 inches) wide by 2590 pixels (27 inches) tall and was reduced to fit on this page. Most infographics are published at 800 pixels wide and as many pixels it takes to fit all of the information vertically, but since this infographic seen here was posted to a blog, the width was made smaller to accommodate sidebars on the blog page.
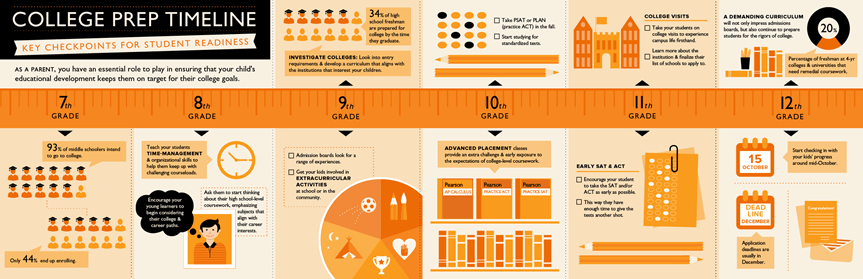
Horizontal Layout
The horizontal layout is usually not very user-friendly, unless, of course, the website where it is used has coded their screen to scroll horizontally with a standard computer mouse; otherwise, the viewer will have to use a scroll bar located at the bottom of the screen in order to take in all of the information.
Another drawback to this type of design is that when it is reduced to fit the width of a blog page, it becomes too small to read. The original size of the College Preparation Infographic from Pearson Education (2014), seen below is 2448 pixels (25.5 inches) wide by 792 pixels (8.25 inches) tall, but when fitted to this web page, it becomes illegible.
Full-Page Layout
The full-page infographic is ideal for websites that do not want or need their viewers to scroll. These types of infographics are also ideal for printing purposes; all of the information can fit onto one page and can be easily distributed as supplemental handouts during meetings or conferences. Full-page infographics are also ideal for making into posters.
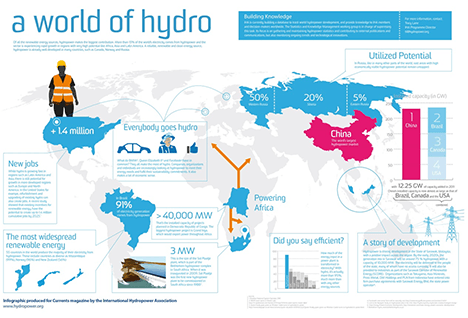
Infographic produced for Currents magazine by the International Hydropower Association (2012, Dec.)